5 September 2026 · Updated 21 October 2026

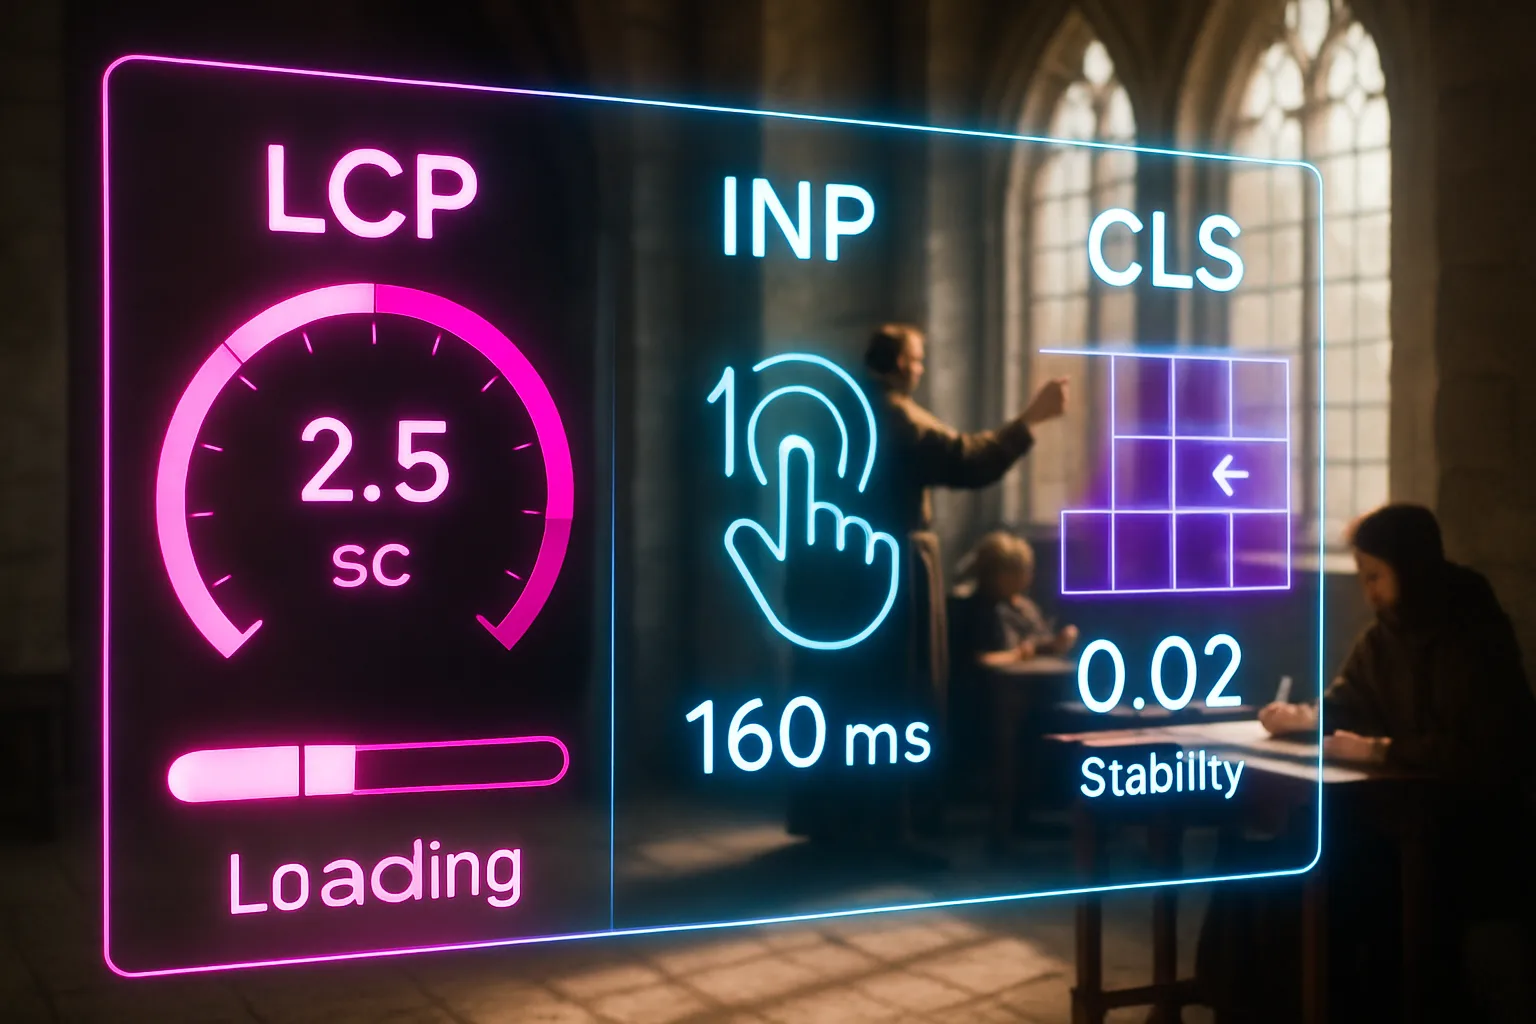
Table of Contents
- What is Core Web Vitals explained in plain terms?
- Key Takeaways
- LCP: the metric measuring how fast your main content appears
- INP: the metric measuring how quickly your page responds to a tap or a click
- CLS: the metric measuring whether your layout stays still while loading
- Why Google uses these three metrics as ranking signals
- How Google measures your Core Web Vitals and where to find your score
- What a passing score means for your site's visibility
- Closing reflection
- Frequently Asked Questions
A plumber in Dublin built his new website over a weekend and pressed publish. The design looked sharp on his laptop. Within a week his enquiry form had received nothing. A competitor three postcodes over, with an older-looking site, was booking three jobs a day. The plumber checked his own site on his phone: the hero image took four seconds to appear, the booking button jumped down the page while things were still loading, and tapping the form field did nothing for a moment before the keyboard appeared. Visitors were arriving and leaving before anything finished loading.
What is Core Web Vitals explained in plain terms?
Core Web Vitals are three measurements Google uses to score how a page feels to the person loading it, not how it looks in a design tool. Google's documentation says they measure real-world loading, how quickly a page responds to input, and how stable the layout stays. Google uses them as a ranking signal, so poor scores carry a disadvantage.
Key Takeaways
- Core Web Vitals are three measurable signals: LCP (how fast the main content loads), INP (how quickly the page responds when someone interacts with it), and CLS (how much the layout shifts while loading).
- Each metric has a passing threshold. Hitting "good" on all three puts your page in a stronger position than competitors failing one or more of them.
- Google measures these signals using real data from real visitors, not from lab simulations, so your actual audience's experience is what counts.
- Poor scores don't cause an instant ranking collapse, but they are a confirmed ranking factor, and they directly affect whether visitors stay or leave.
- Google Search Console shows your site's current Core Web Vitals status for free, grouped by page and by pass or fail, so you know exactly where the problem sits.
LCP: the metric measuring how fast your main content appears

LCP stands for Largest Contentful Paint. The name is technical, but the idea is simple: it measures how long it takes for the biggest visible element on your page to fully appear on screen. That element is usually a large image at the top of the page, a banner, or a large block of text. It's not the moment the page starts loading; it's the moment the main piece of content a visitor came to see becomes visible.
The passing threshold is 2.5 seconds or faster. Pages taking between 2.5 and 4 seconds fall into a "needs improvement" band, and anything slower than 4 seconds is rated poor, as confirmed by performance threshold benchmarks published by performance research teams. A visitor clicking your search result and staring at a blank or half-loaded page for three seconds has already begun deciding whether to go back. Most do. A 2023 study found conversion rates drop by roughly 4.4 percent for every additional second of load time beyond the first. For a plumber getting five enquiries a week, losing even one to a slow image is a real cost, not a theoretical one.
The most common culprits behind a slow LCP score are large, uncompressed images, a slow hosting server, and resources blocking the page from rendering. Fixing your LCP score is largely a question of addressing those three things in order.
INP: the metric measuring how quickly your page responds to a tap or a click
INP stands for Interaction to Next Paint. Google replaced an older metric called FID (First Input Delay) with INP in March 2024, because INP measures the full range of interactions a visitor has with a page, not only the first one. Every button tap, every form click, every dropdown selection, every typed character, is measured from the moment the visitor acts to the moment the page visibly responds. INP takes the worst of those response times across the session and uses that as the score.
The passing threshold is 200 milliseconds or faster. Interactions taking between 200 and 500 milliseconds need improvement, and anything slower than 500 milliseconds is poor. To put that in physical terms: 200 milliseconds is about the time it takes to blink. When a page responds faster than a blink, it feels instant. When it takes half a second or longer, it feels broken, and visitors often tap again, which makes things worse.
The three Core Web Vitals metrics and their passing thresholds
| Metric | What it measures | Good | Needs Improvement | Poor |
|---|---|---|---|---|
| LCP | Time for main content to appear | 2.5 s or faster | 2.5 s to 4.0 s | Slower than 4.0 s |
| INP | Page response time to a tap or click | 200 ms or faster | 200 ms to 500 ms | Slower than 500 ms |
| CLS | How much the layout shifts while loading | 0.1 or lower | 0.1 to 0.25 | Higher than 0.25 |
A slow INP score typically points to JavaScript running while the visitor is trying to interact. Pages carrying too many third-party scripts, for example chat widgets, ad trackers, and analytics tools loaded simultaneously, are the most common offenders. INP is the metric most likely to be poor on a page decorated with plugins and integrations over time, because each addition adds processing work the browser must finish before it can respond to a tap.
CLS: the metric measuring whether your layout stays still while loading
CLS stands for Cumulative Layout Shift. It measures how much the visible content of a page moves around while the page is still loading. If you've ever started reading a paragraph on a website, then had an advertisement load above it and push the text down so your eye lost its place, you've experienced a high CLS score in practice.
CLS is scored on a scale where lower is better. A score of 0.1 or lower is good. Between 0.1 and 0.25 needs improvement. Above 0.25 is poor. The score is calculated by combining how much content moved and how far it moved, so a large image appearing at the top of the page and pushing everything down will score worse than a small icon shifting a few pixels.
The experience a high CLS score creates is frustrating in a specific, physical way. A visitor reaching to tap a button can tap a different link instead if the layout shifts at the wrong moment. On a mobile phone, this can mean an accidental click somewhere unintended, which usually ends the visit. High CLS most often comes from images or video elements with no size specified in the code, from web fonts loading after the text they replace, and from third-party ad slots appearing above existing content. These are fixable, but they require deliberate attention to how resources are declared and in what order they load.
Why Google uses these three metrics as ranking signals
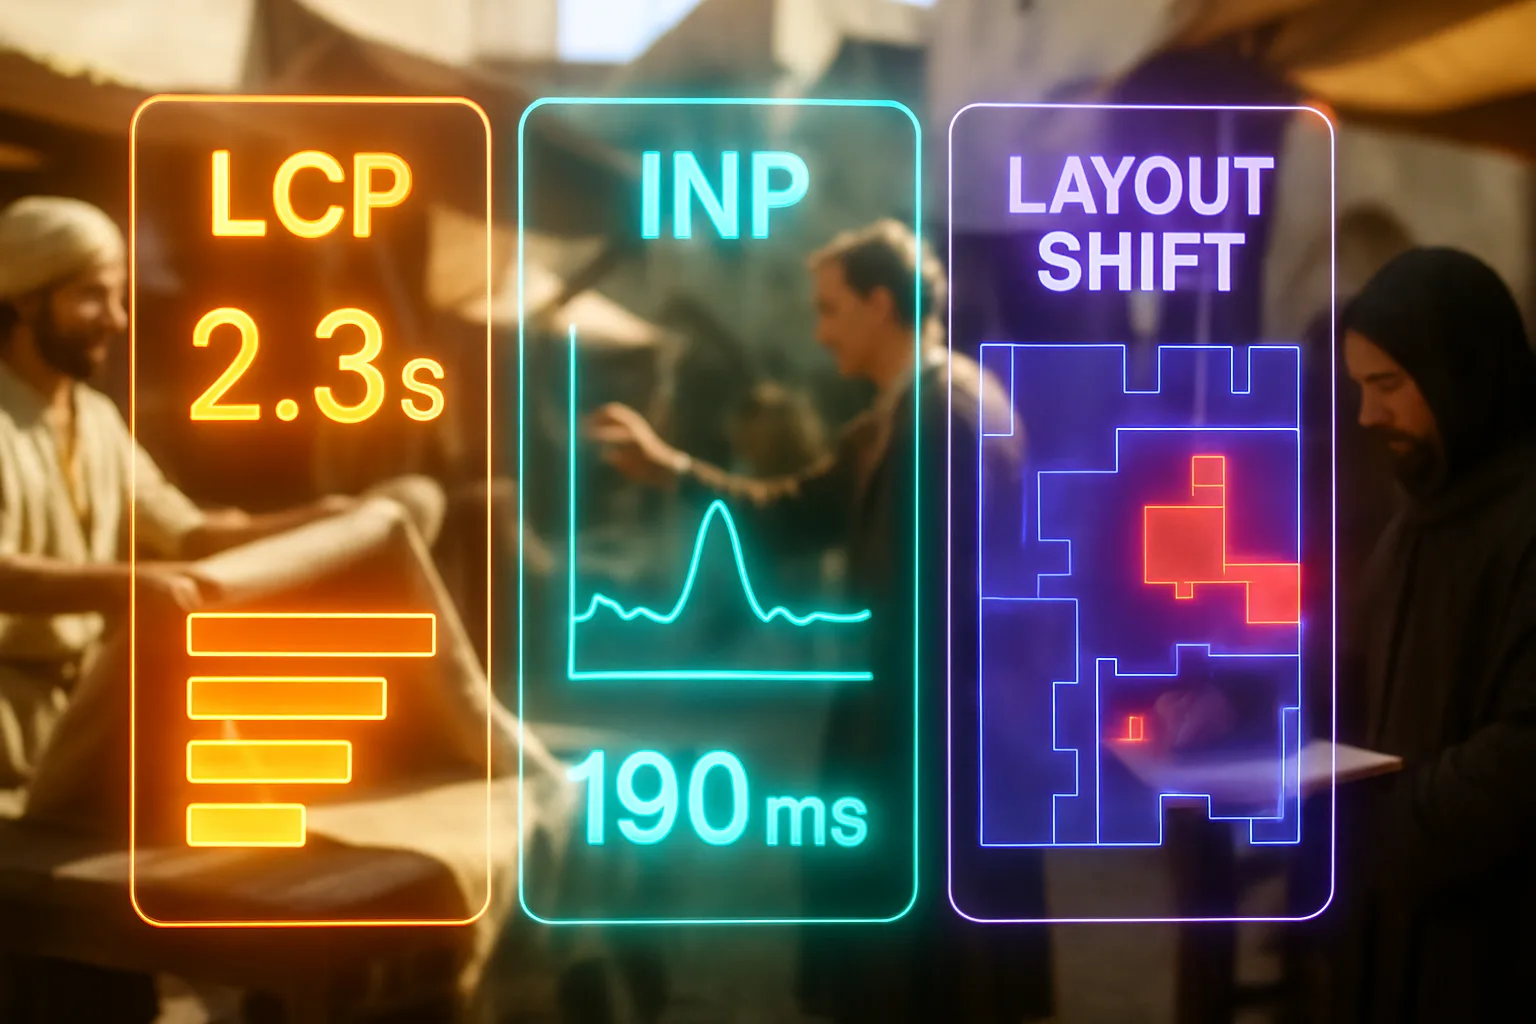
Google's position is straightforward: pages providing a poor user experience shouldn't rank ahead of pages providing a good one, all other factors being equal. The Core Web Vitals ranking signal was incorporated into Google's search ranking systems as part of what Google called the Page Experience update, which rolled out in 2021 and was completed by 2022. The metrics weren't invented as ranking factors; they were built first as diagnostic tools for developers, and Google adopted them for ranking because they correlate with the things visitors complain about: slow pages, unresponsive pages, and pages jumping around.
The signal isn't binary. It doesn't flip a page from visible to invisible. It works as a tiebreaker: when two pages are otherwise comparable on content quality, relevance, and links, the page with better Core Web Vitals tends to win the position. That framing undersells the practical consequence for small business sites, because a site failing all three metrics isn't losing to one superior competitor; it's losing to every competitor whose site loads cleanly, and those competitors don't need to be exceptional in any other way to pull ahead. Research on page experience and search rankings consistently points toward Core Web Vitals as one of the more stable signals Google has maintained over multiple algorithm cycles.
How Google measures your Core Web Vitals and where to find your score
Google doesn't measure your Core Web Vitals from a data centre running a single test. It collects real data from real visitors using Google Chrome, which reports performance data back to Google through what is called the Chrome User Experience Report. Your score reflects what your actual audience experiences, across their actual devices, on their actual connections. A page scoring well on a fast laptop connected to fibre may score poorly for visitors on older phones using mobile data, and that second group is often the majority.
Your scores are accessible in two places. Google Search Console has a dedicated Core Web Vitals report, which groups your pages by status (good, needs improvement, or poor) and by metric, so you can see which pages are failing and which metric is causing the failure. PageSpeed Insights, Google's free diagnostic tool, shows both your real-world field data and a simulated lab score for a single URL, along with a list of specific issues contributing to each metric's result. Both tools are free. The data in Search Console reflects the experiences of visitors over the previous 28 days, so a fix made today will take weeks to show in the aggregated score. Worth knowing before concluding a fix made no difference.
What a passing score means for your site's visibility
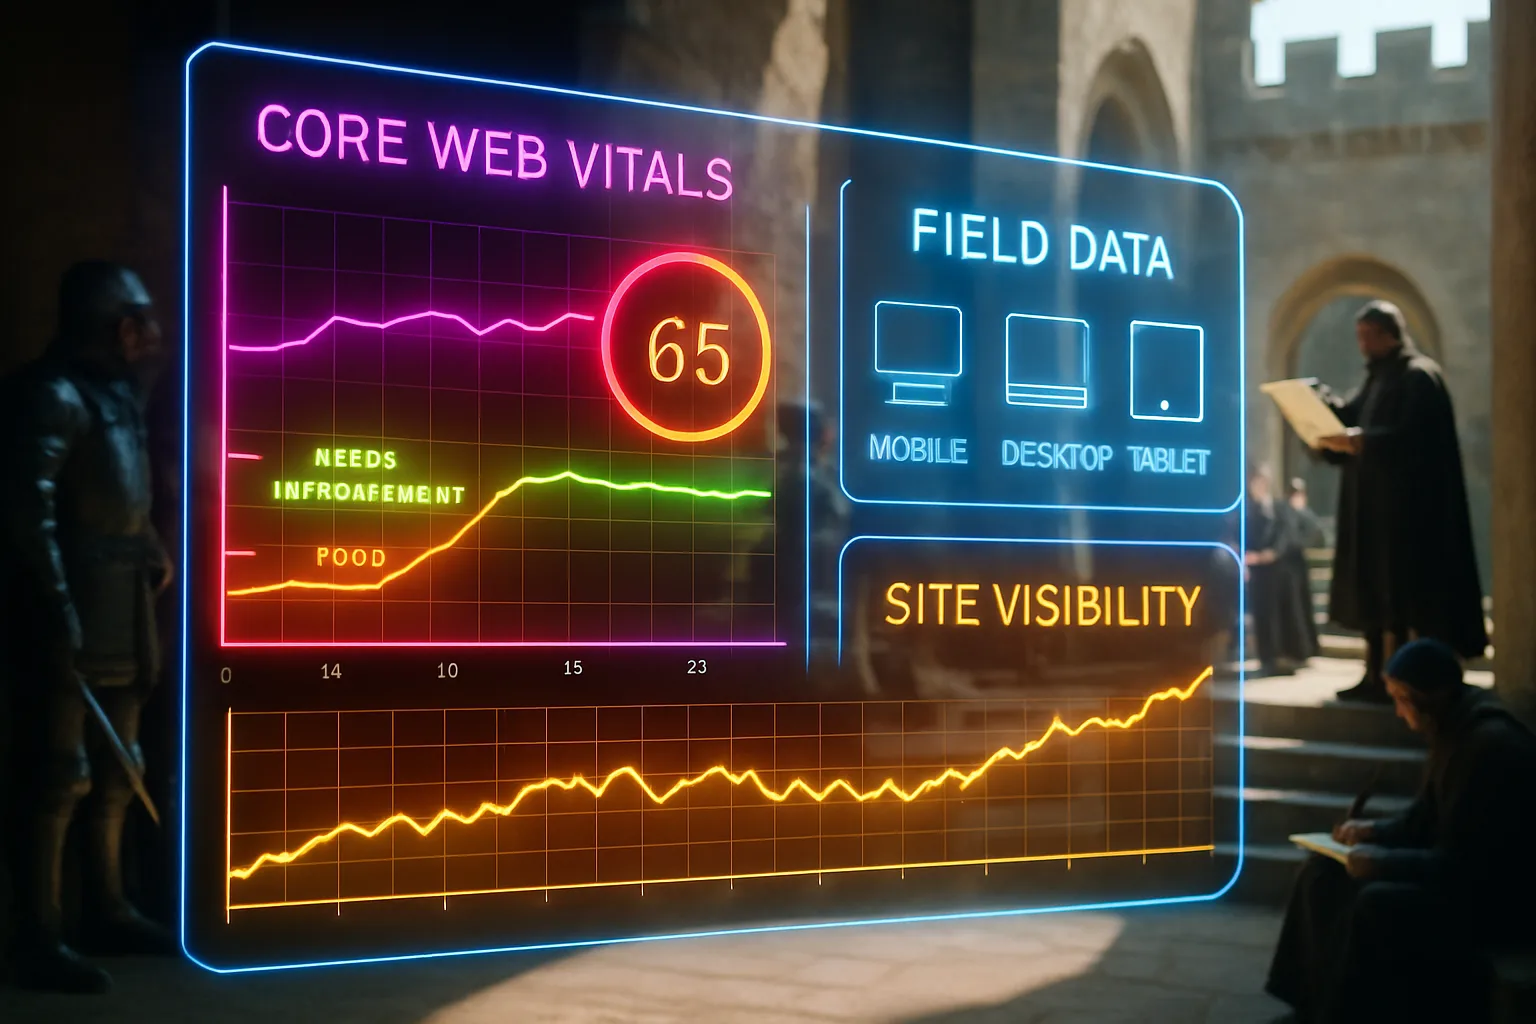
Passing Core Web Vitals isn't a guarantee of a good ranking. No single metric is. What it does is remove a confirmed disadvantage. A site failing its LCP, INP, or CLS scores carries a handicap competitors with better performance don't carry, and that handicap compounds over time as Google's real-user data builds up. According to research into site speed and business outcomes, pages meeting performance thresholds also show lower bounce rates and higher conversion rates. These are correlated outcomes: a page loading fast, responding quickly, and staying still is easier to use, and easier to use means more people stay and act.
A useful framing is to treat website speed as a floor, not a ceiling. Getting your Core Web Vitals into the "good" range doesn't push you to the top of the results on its own, but it stops the floor from dropping out beneath you. A physiotherapy clinic in Manchester with detailed, genuinely useful content about common knee injuries will still beat a fast-loading page with nothing useful on it. But that same clinic with poor Core Web Vitals will lose to a competitor with equally useful content and a site loading in 1.8 seconds. The metrics are the entry condition, not the prize.
Closing reflection
Your website is already being scored. Every visitor arriving on your site using Chrome contributes to Google's picture of how the page performs, and that picture is updated continuously. The three metrics doing the measuring aren't obscure technical details reserved for developers. They describe three things any visitor can feel: whether the page is slow to show its content, whether it takes time to respond, and whether things jump around while it loads. Your score isn't a grade you receive; it's a description of what your visitors are already experiencing.
You shouldn't have to guess whether your page experience scores are holding your rankings back. With Zahavah Studio you won't.
Contact Zahavah Studio to get a plain-English audit of your Core Web Vitals scores and a clear list of what to fix first.
If your scores are already in the "needs improvement" band, or if you're not sure where they sit at all, the questions below cover what most site owners ask once they see their first report.
Frequently Asked Questions
What are Core Web Vitals and how do they relate to my search rankings?
Core Web Vitals explained simply: they are three measurements Google collects from real visitors to your site, covering how fast your main content loads (LCP), how quickly your page responds to taps and clicks (INP), and how much your layout moves while the page is building itself (CLS). According to Google Search Central, Google uses these signals as part of its ranking systems, meaning pages performing well on all three carry an advantage over comparable pages performing poorly on one or more.
The connection to your rankings is real but not absolute. Core Web Vitals act more like a tiebreaker than a primary signal: when your content and authority are comparable to a competitor's, the page with better scores tends to win the position. The practical consequence for most small business sites is that failing even one metric gives ground to competitors who have addressed these issues, even if those competitors have done nothing else particularly impressive. The metrics are stable ranking factors, confirmed as such since 2021. Treating them as optional is treating your visitor's experience as optional, and Google reads those as the same thing.
How do I check my Core Web Vitals score without a developer?
You can check your Core Web Vitals scores using two free tools from Google, and neither requires any technical background to read. Google Search Console groups your site's pages by performance status across all three metrics, showing which pages are good, which need improvement, and which are rated poor. If you haven't connected your site to Google Search Console yet, that's the starting point. The second tool is PageSpeed Insights, where you paste any URL from your site and receive a report within seconds. The report shows your real-world field data, drawn from actual Chrome visitors over the past 28 days, and a simulated lab score with a specific list of issues causing the slowdown.
Both reports name the metric failing and describe the element causing the failure, for example "the hero image at the top of the page is taking 3.8 seconds to load". That description is usually enough to take to a developer and say: fix this specific thing. You don't need to understand the technical fix; you need to understand what the report is pointing at.
How long does it take for a Core Web Vitals fix to show in my scores?
Core Web Vitals scores in Google Search Console are based on a rolling 28-day window of real visitor data, which means a fix made today won't appear in your Search Console report for several weeks. This is a common source of frustration, and it trips up many site owners who make a change, check their report two days later, and conclude the fix made no difference. It didn't fail; the data hasn't refreshed yet.
PageSpeed Insights, by contrast, reflects the current state of your page immediately, because the lab portion of the report simulates your page at the moment you test it. If you want to confirm a fix worked before the Search Console data catches up, test the same URL in PageSpeed Insights before and after the change. You'll see the simulated score shift within minutes. The field data section of the same tool also updates more frequently than the Search Console report, so it's a useful early indicator of whether real-user scores are moving in the right direction.
Why did my INP score get worse after I added a new plugin or widget?
INP measures how long your page takes to respond after every tap or click, and it scores the worst interaction in a session, not the average. Each plugin, chat widget, or third-party script you add to a page runs JavaScript in the browser while the visitor is trying to use the page. When two or three scripts are competing to run at the same time as the visitor taps a button, the browser queues those tasks, and the visitor's interaction waits in line. The result is a response time feeling broken, a delay measured in milliseconds but felt straight away.
The INP metric replaced an older measure called FID in March 2024 precisely because FID only measured the first interaction and missed the cumulative effect of multiple scripts on subsequent interactions. Your INP score is a measure of how much background work your page is doing every time a visitor tries to use it. Adding features to a site without auditing the JavaScript they introduce is one of the most reliable ways to cause an INP failure, which is why sites with many years of accumulated plugins tend to score worst on this particular metric.

Yvonne van Wyk
SEO Strategist · Zahavah Studio
Yvonne van Wyk runs Zahavah Studio, a Johannesburg SEO agency focused on long-term search visibility and AI citation. Her writing covers local SEO, content strategy, analytics, and the mechanics of how search works.
Everything on this blog is written to inform and educate. It is for information only. Nothing here is professional legal, financial, or technical advice. If you are making a significant business decision, speak to a qualified professional first. Zahavah Studio works hard to keep this content accurate and current, but is not liable for decisions made based on what you read here.